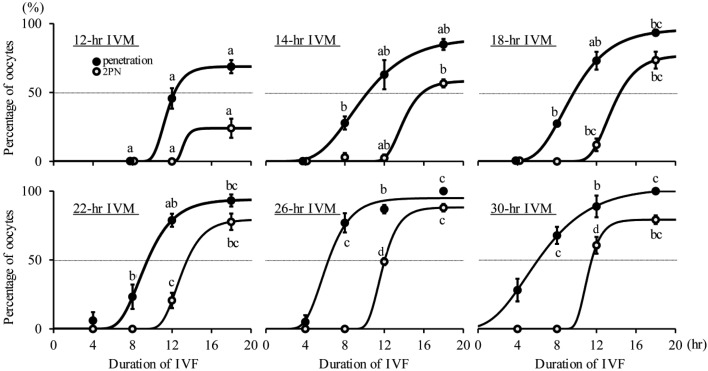
Fig. 2.
The effects of duration of IVM on sperm penetration and pronucleus (PN) formation after IVF. Gompertz curves (bold solid line) were fitted to the data of sperm penetration and PN formation. The equations of the curves for the percentage of oocytes penetrated were y=68.8 × exp (− e− 0.990 (x − 11.1)) (r2=0.871), 89.6 × exp (− e− 0.306 (x − 8.55)) (r2=0.877), 96.0 × exp (− e− 0.382 (x − 8.59)) (r2=0.964), 93.9 × exp (− e− 0.519 (x − 8.64)) (r2=0.934), 94.9 × exp (− e− 0.615 (x − 5.62)) (r2=0.946) and 1.02 × 10² × exp (− e− 0.281 (x − 4.88)) (r2=0.874) for 12, 14, 18, 22, 26 and 30 hr of IVM, respectively. The equations of the curves for the percentage of oocytes with 2PN were y=24.1 × exp (− e− 2.24 (x − 13.0)) (r2=0.706), 58.4 × exp (− e− 0.775 (x − 13.5)) (r2=0.970), 77.1 × exp (− e− 0.608 (x − 13.0)) (r2=0.950) 79.4 × exp (− e− 0.693 (x − 12.4)) (r2=0.949), 88.2 × exp (− e− 0.912 (x − 11.4)) (r2=0.991) and 79.3 × exp (− e− 1.12 (x − 10.8)) (r2=0.966) for 12, 14, 18, 22, 26 and 30 hr of IVM, respectively. Dotted line shows 50%. a,b,c,d Values with different characters differ significantly in the percentage of sperm penetration and PN formation at each time post-insemination (P<0.05). Each group had 2-4 replicates and 21-46 oocytes.

