
Figure 1.
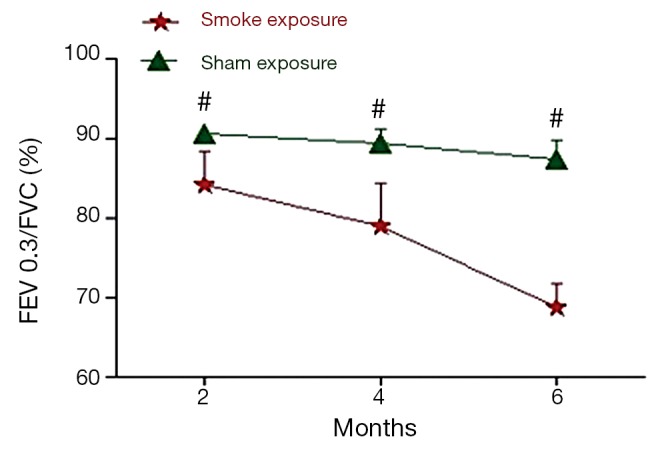
FEV0.3/FVC% are shown expressed in percentage for each of the 2-, 4-, and 6-month time periods. Values = mean ± SD. #, indicate P<0.05 or greater significant difference between sham exposed (n=6) and smoke-exposed (n=6) rats; SD, standard deviation.