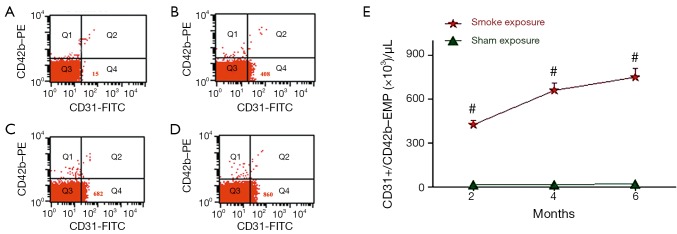
Figure 3.

Representative examples of flow cytometry of CD42b–/CD31+ EMP in a rat exposed to smoke 2 months (B) 4 months (C) and 6 months (D) and a rat of sham exposure groups (A). The points represented in region Q4 of both examples are CD31+ (positive) and CD42- (negative); therefore they are considered to be EMPs. In region Q4 (lower right of histogram), there is a visibly more dense cluster of EMPs in the rat exposed to smoke (B, C, D) compared with in the rat of sham exposure groups (A). In these examples, the rat exposed to smoke 2 months had 408 EMPs (B), the rat exposed to smoke 4 months had 682 EMPs (C), the rat exposed to smoke 6 months had 860 EMPs (D), and the rat of sham exposure groups had 15 EMPs (A). (E) CD42b–/CD31+ EMP counts are shown for each of the 2-, 4-, and 6-month time periods. Values = mean ± SD. #, indicate P<0.05 or greater significant difference between sham exposed (n=6) and smoke-exposed (n=6) rats; EMP, endothelial microparticle; SD, standard deviation.
