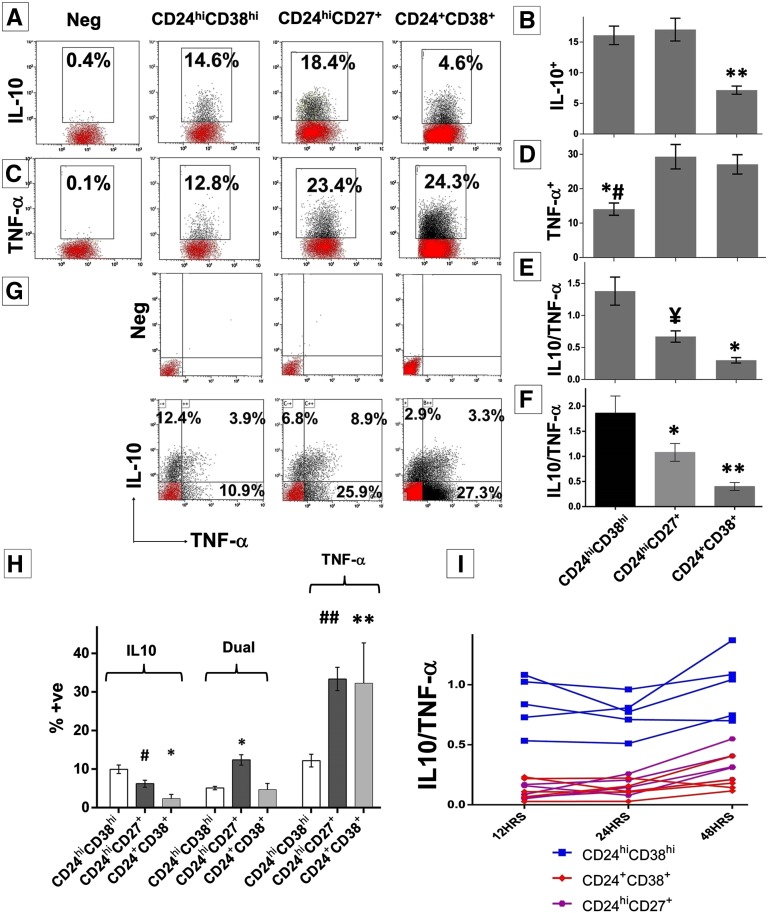
Figure 2.
Analysis of IL-10 and TNF-α expression by B subsets. Magnetic bead–enriched CD19+ B cells are stimulated with CpG and CD40L for 48 hours plus phorbol ester, ionomycin, and brefeldin A (last 5 hours). (A and C) Each representative dot plot shows the frequencies of IL-10+ or TNF-α+ B cells within the respective B subsets. (B and D) Cumulative frequency (mean±SEM) of IL-10 (*P<0.001, TrB versus memory or naive) and TNF-α producing cells (*#P=0.001, TrB versus memory; P=0.01, TrB versus naïve) within each B cell subset in 15 healthy volunteers. (E) Analysis of the ratio of IL-10+/TNF-α+ cells within B cell subsets analyzed by flow cytometry (¥P=0.002, TrB versus memory; *P<0.001, TrB versus naïve). (F) Cumulative results expressed as mean±SEM for the IL-10/TNF-α ratio obtained from purified B cell subsets and analyzed by ELISA in 11 healthy volunteers (*P<0.001, TrB versus memory or naive). (G) Representative dot plot for the combined analysis of IL-10 and TNF-α by dual staining in the B subsets. (H) Cumulative results (mean±SEM) from six healthy volunteers of the distribution of either IL-10+ or TNF-α+ or mixed cytokine-positive B cells (*P<0.001; #P=0.01; **P=0.001; ##P<0.001, in comparison with TrBs). (I) Analysis of IL-10+ and TNF-α+ B subsets at 12, 24, and 48 hours in five independent controls after stimulation with CpG and CD40L. The graphs represent the IL-10/TNF-α ratio obtained for the respective B-cell subset at the three different time points in five healthy volunteers. Statistical analysis is performed by ANOVA using Tukey post hoc correction for multiple comparisons.

