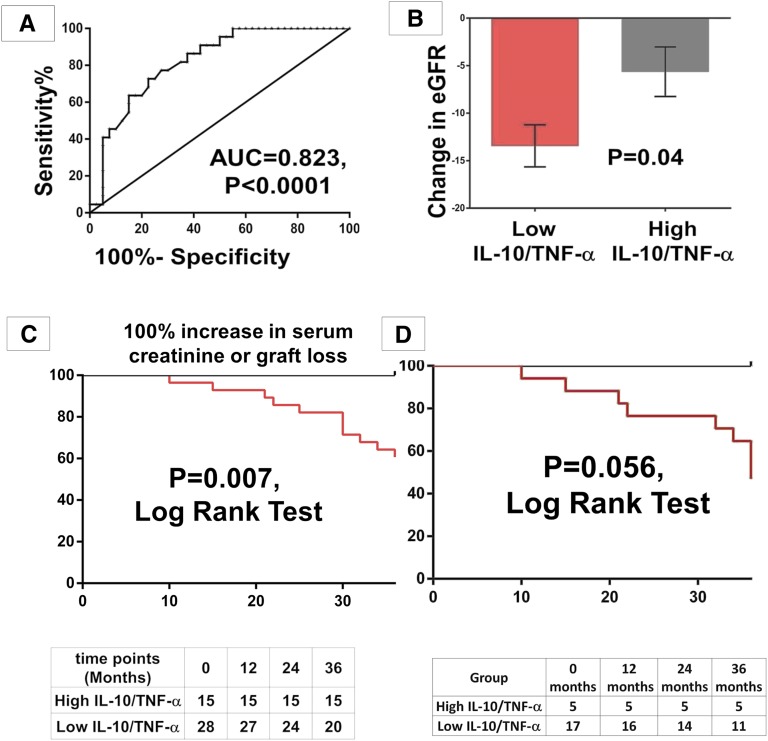
Figure 7.
Clinical significance of TrB IL-10/TNF-α in patients with graft dysfunction. (A) Receiver operating characteristic curve showing the ability of TrB-IL-10/TNF-α to distinguish stable grafts and rejection. All patients who are biopsied are divided into those with a high or low IL-10/TNF-α based on the mean IL-10/TNF-α for the group. (B) Bar chart showing the change in eGFR (Δ eGFR) over 3 years from the time of the biopsy in patients with graft dysfunction (mean±SEM) based on their IL-10/TNF-α (TrB). (C) Kaplan–Meier survival analysis for the high and low IL-10/TNF-α (TrB) for 100% increase in serum creatinine or graft loss over 3 years in patients with graft dysfunction. (D) Kaplan–Meier survival analysis for the high and low IL-10/TNF-α (TrB) for a 100% increase in serum creatinine or graft loss over 3 years in the GD-R group. Statistical analysis is performed by a Mann–Whitney U test and survival analysis is performed by the Kaplan–Meier method. Groups are compared using the log-rank test.

