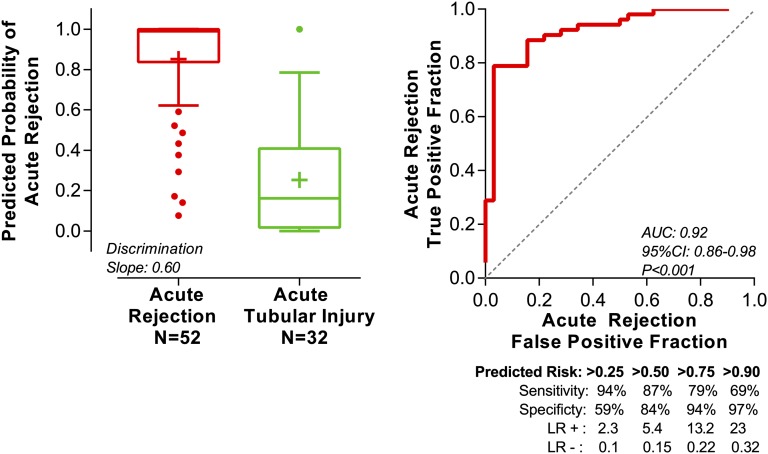
Figure 2.
Predicted probability of AR from the 10-fold cross-validation of the six-gene urinary cell diagnostic signature. We measured absolute levels of 26 mRNAs and 18S rRNA in the urinary cells from 84 kidney graft recipients. We used quadratic discriminant function analysis to derive linear combination of mRNAs to better differentiate 52 AR biopsies (ACR and AMR; n=52 patients) from 32 ATI biopsies (n=32 patients) than any single mRNA measure. A linear combination of six mRNAs (CD3ε, CD105, TLR4, CD14, Complement Factor B, and Vimentin) emerged as the parsimonious model and yielded a discriminant score that constituted the diagnostic signature. We did 10-fold cross-validation to internally validate the six-gene diagnostic signature. The entire study cohort of 84 patients was randomly divided into 10 equal groups. Within each of 10 groups, the proportion of samples (AR versus ATI) was similar to the undivided cohort. At the first run, group 1 (10% of samples) was excluded, and a signature was derived from the remaining nine groups (90% of samples), including both variables selection and model fitting. Next, this newly derived signature was applied to samples of group 1 to predict their diagnostic outcome. In the second run, group 2 was excluded, and a signature was derived from the remaining nine groups (90% of samples), including both variables selection and model fitting. This newly derived signature was applied to samples of group 2 (10% of samples) to predict their diagnostic outcome. This iteration was done for all 10 groups. Thus, all observations were used for both deriving and validating a model, and each observation was used for validation exactly one time. Accordingly, the predicted probability for an individual patient was derived from a model that did not include any data from that patient. We used the predicted probability for each patient from the cross-validation to construct an ROC curve. The left panel shows the box plot of predicted probability of AR from the cross-validation. The horizontal line within each box represents the median, and the plus symbol represents the mean. The bottom and top of each box represent 1.5 times the interquartile range. The values beyond 1.5 times the interquartile range are shown as dots. The discrimination slope is the difference between the means of the predicted probabilities of the two groups. The right panel shows the ROC curve of the predicted probability for each patient from the cross-validation to diagnose AR. The sensitivity (true positive fraction), specificity (false positive fraction), likelihood ratio of a positive test (LR+; sensitivity/1−specificity), and likelihood ratio of a negative test (LR−; 1−sensitivity/specificity) for various cutpoints of predicted risks are shown beneath the x axis. The AUC is the estimate of the expected value in an independent sample not used for deriving the diagnostic signature.

