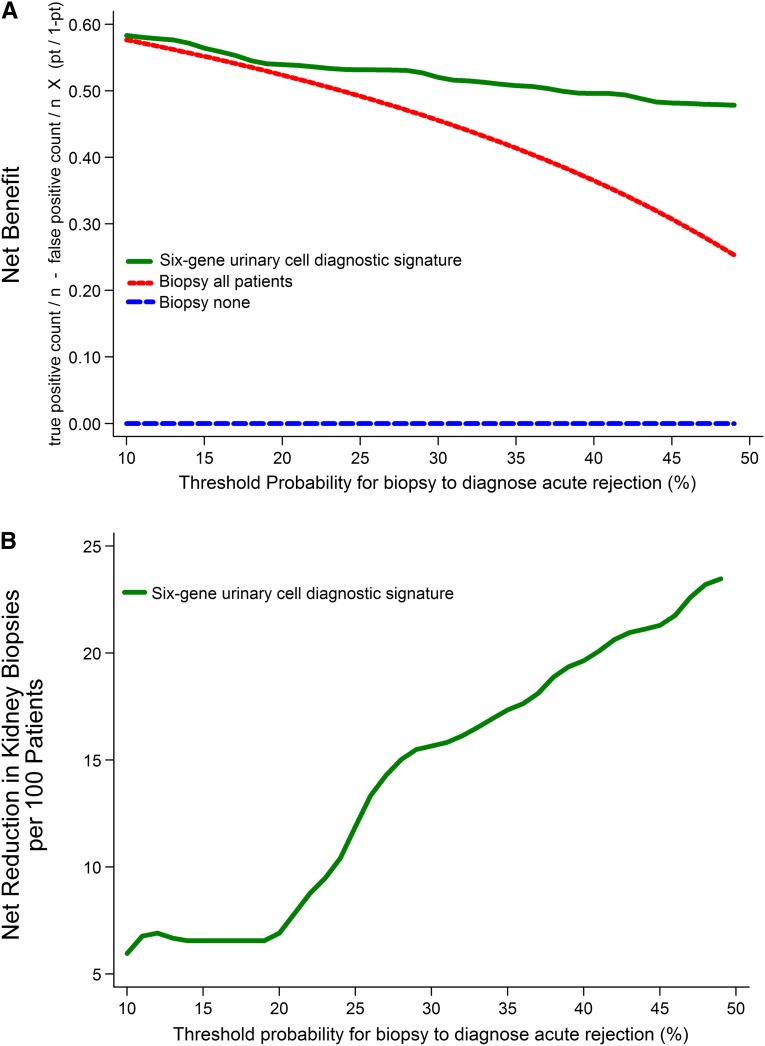
Figure 3.
Decision curve analysis to assess the clinical benefit of the six-gene urinary cell diagnostic signature to differentiate AR from ATI. We used the predicted probability for each patient from the 10-fold cross-validation in decision curve analysis to quantify the clinical benefit of the diagnostic signature in terms of the number of unnecessary biopsies that can be avoided in the diagnosis of AR. In the upper panel, the y axis represents the net benefit ((true positive count/n)−(false positive count/n)×[pt/(1−pt)]), where true positive count is the number of patients with AR, false positive count is the number of patients with ATI, n is the total number of patients, and pt is the threshold probability. Here, pt/(1−pt) is the ratio of the harms of false positive to false negative results. Of 84 patients that we studied, 52 (62%) patients had AR. This proportion of AR is a reasonable approximation of the expected incidence of AR in consecutive for-cause (diagnostic) biopsies done to identify the cause of acute graft dysfunction. The green line is the net benefit of the urinary cell diagnostic signature. This strategy is compared with the biopsy all patients strategy (red line), which is essentially the current approach. The blue line, which represents no net benefit, is the biopsy none strategy. The decision curve plot depicts that, among patients who present with acute graft dysfunction, within a reasonable physician/patient threshold probability for doing a biopsy to diagnose AR, the use of urinary cell diagnostic signature is beneficial compared with the current biopsy all patients strategy. In the lower panel, for each threshold probability on the x axis, the corresponding value on the y axis represents the net reduction in avoidable biopsies per 100 patients when using the diagnostic signature.

