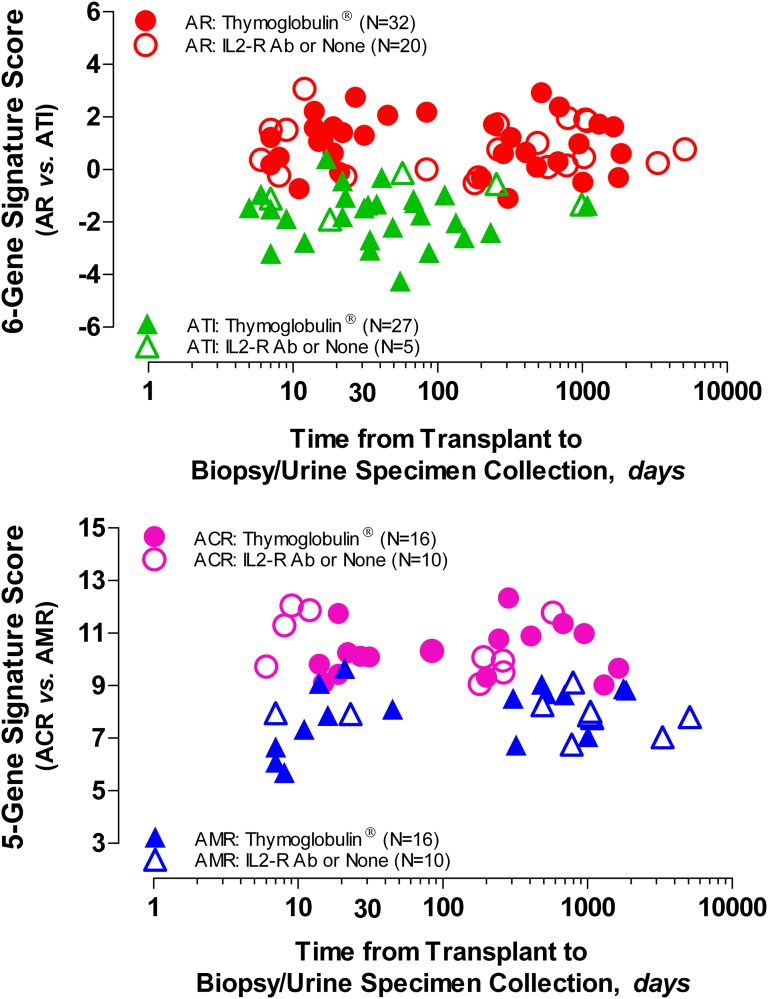
Figure 5.
Relationship between the urinary cell diagnostic signature score and the time from transplantation to biopsy/urine sample collection. The diagnostic signature score is represented on the y axis (upper panel, six-gene signature; lower panel, five-gene signature), and time from transplantation to biopsy/urine sample collection, in logarithmic scale, is represented on the x axis. Induction immunosuppression therapy with lymphocyte-depleting Thymoglobulin (including one patient with alemtuzumab) is shown as closed symbols, whereas induction with lymphocyte-nondepleting IL-2 receptor antibody or no induction therapy is shown as open symbols. Within each diagnostic category, analysis involving Spearman rank order correlation showed that there was no significant association (P>0.05) between the score of the six- or five-gene diagnostic signatures and the time from transplantation to biopsy in patients with biopsies showing ACR, AMR, or ATI and induced with depleting or nondepleting antibodies. There was also no association between the scores of the signatures and either serum creatinine levels (six-gene signature: ACR: rs=−0.39, P=0.06; AMR: rs=−0.19, P=0.30; ATI: rs=−0.002, P=0.90; five-gene signature: ACR: rs=−0.14, P=0.50; AMR: rs=−0.07, P=0.70) or tacrolimus trough levels (six-gene signature: ACR: rs=0.14, P=0.50; AMR: rs=−0.14, P=0.50; ATI: rs=−0.02, P=0.90; five-gene signature: ACR: rs=−0.12, P=0.60; AMR: rs=−0.02, P=0.90; not shown).

