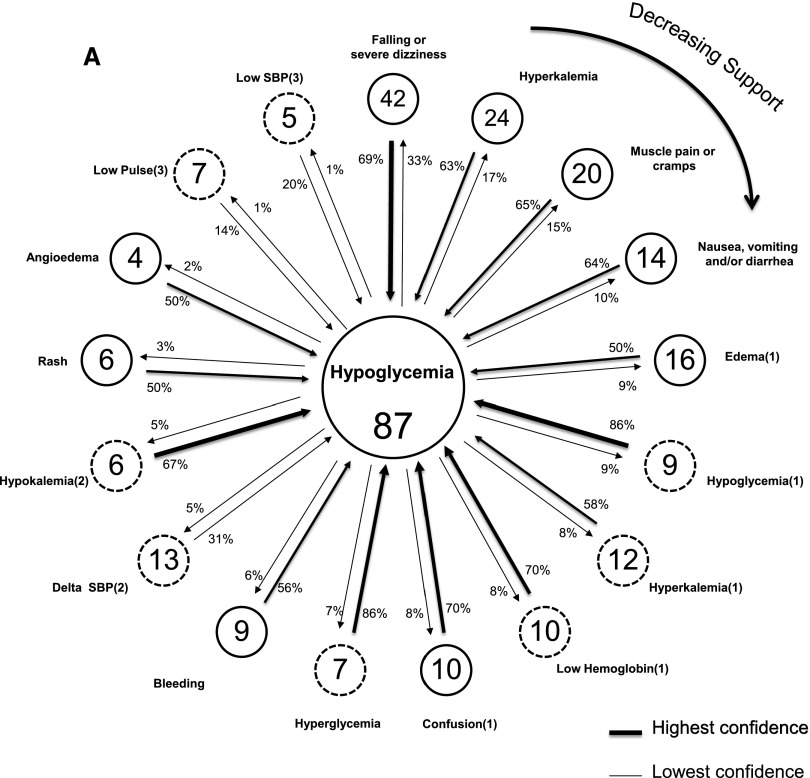
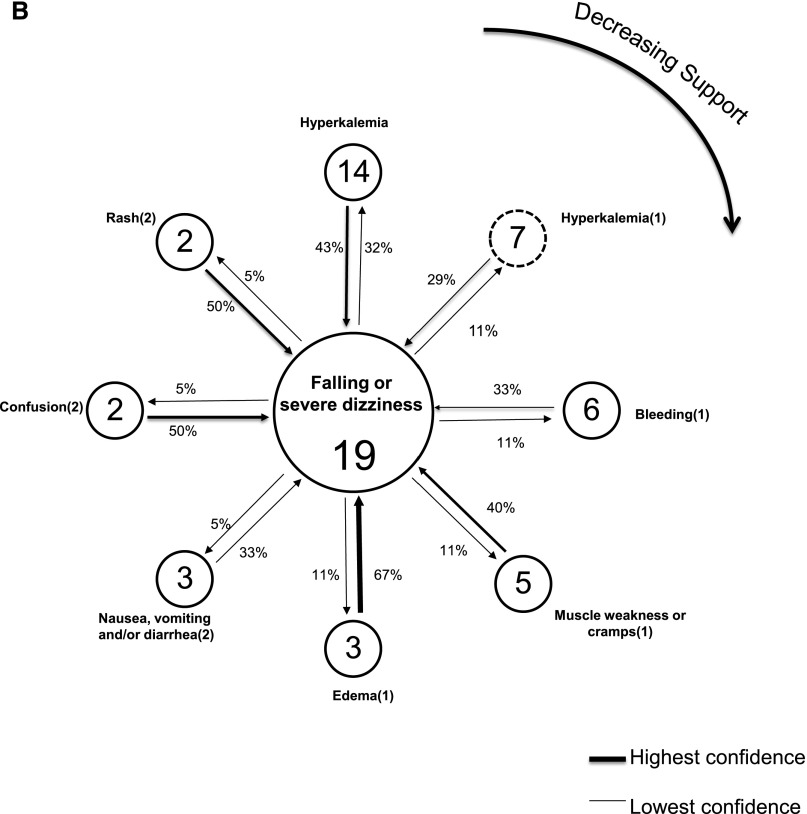
Figure 2.
Link graphs depicting associations of hypoglycemia with other adverse safety events among diabetics, and associations of falling or severe dizziness with other adverse safety events among nondiabetics. (A) Displays adverse safety events related to the index (most common) adverse safety event of reported hypoglycemia (class I) among diabetics with at least one event (n=136). Nodes reflect individual event types and display the number of event occurrences, with arrow links representing the strength of confidence between each event and the index event. Confidence estimates are displayed for the co-occurring events proximate to the arrow representing the assumed directionality, for its computation. Dashed and solid node borders are class I and II events, respectively. The highest support estimate is for the node in the 12 o’clock position, with declining support emanating in a clockwise fashion. SBP, systolic BP. (B) Displays adverse safety events related to the index (most common) adverse safety event of reported falling or severe dizziness (class I) among nondiabetics with at least one event (n=49). Nodes reflect individual event types and display number of event occurrences, with arrow links representing the strength of confidence between each event and the index event. Confidence estimates are displayed for the co-occurring events proximate to the arrow representing the assumed directionality for its computation. Dashed and solid node borders are class I and II events, respectively. The highest support estimate is for the node in the 12 o’clock position, with declining support emanating in a clockwise fashion.


