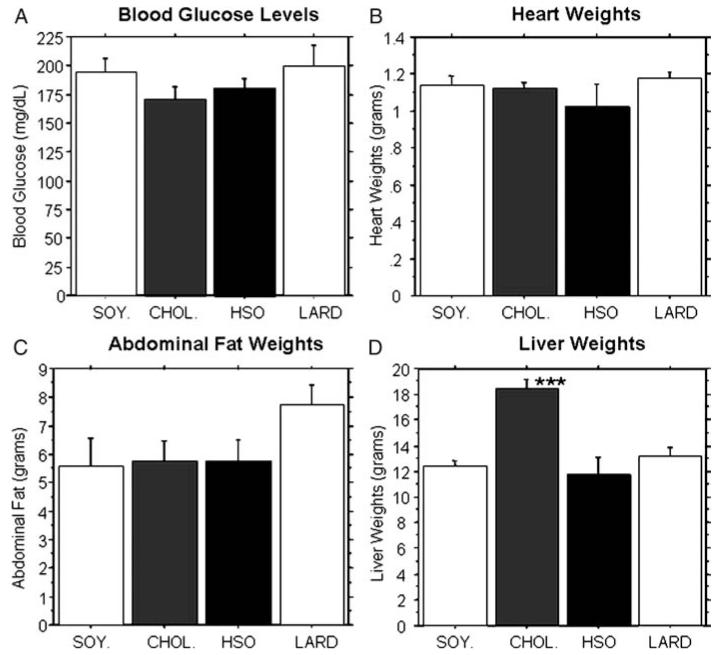
Figure 2.
Blood glucose levels and organ weights. At the time of sacrifice, blood, hearts, abdominal fat pads, and livers were collected for analysis. There were no significant differences found between the groups for blood glucose levels (A), heart weights (B), or abdominal fat pads (C). However, the cholesterol fed animals had significantly elevated liver weights compared to all other groups (D) (P < 0.0001).

