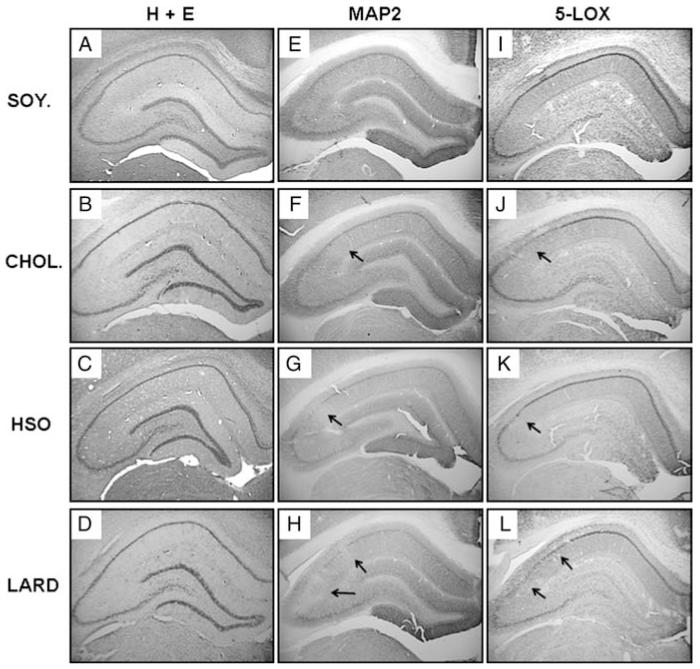
Figure 3.
Immunohistochemistical analysis of the hippocampus. H + E staining (A–D) did not reveal any major differences between groups. However, dietary treatment altered MAP2 expression (E–H) and 5-LOX expression (I–L). Representative results showing areas with reduced immunoreactivity for MAP2 and 5-LOX from the right hemisphere are presented for the control soybean oil diet (A, E, I), cholesterol diet (B, F, J), hydrogenated soybean oil diet (C, G, K), and saturated fat lard diet (D, H, L). Arrows mark areas of loss. Magnification = 2×.

