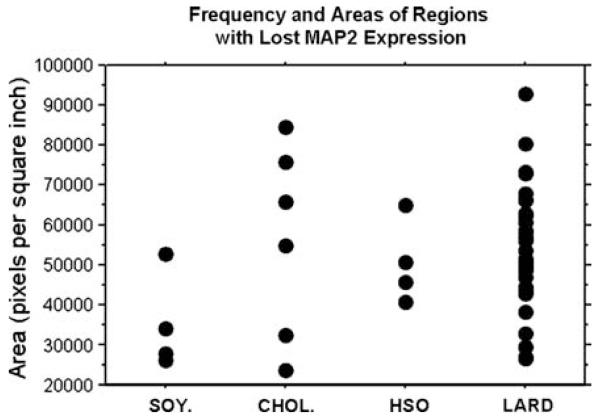
Figure 5.
Frequency and area of regions with lost MAP2 expression. The number of regions with lost MAP2 expression were counted throughout the serial hippocampal sections. Densitometry was also used to measure the areas displaying lost expression. Area is measured in pixels per square inch. The scattergram reveals the ‘LARD’ group with the greatest number of regions with lost MAP2 expression as well as the greatest area covered by these regions.

