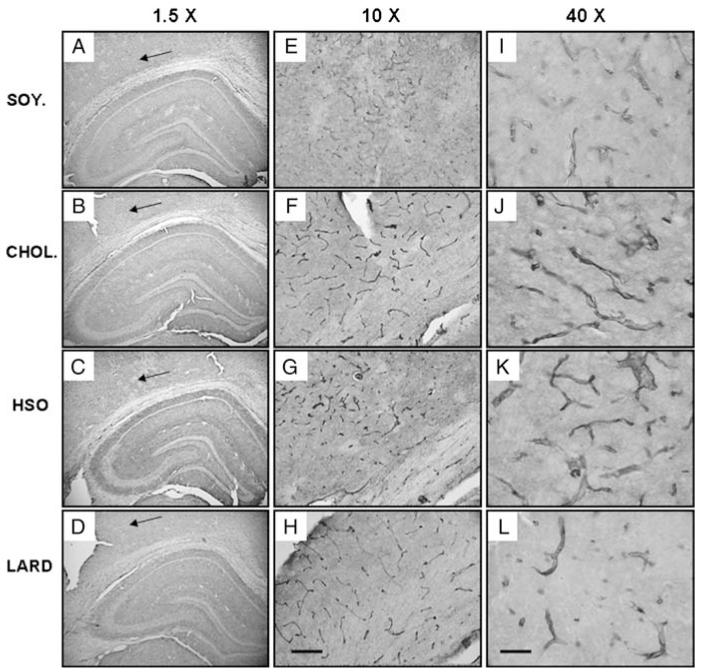
Figure 7.
Blood vessel structure as measured by Glut-1 expression. (A–D) illustrates the whole hippocampus while (E–H) and (I–L) are a higher magnification of what is found at the arrows. The area of interest (arrows) correlates with areas shown previously with a loss of MAP2 expression, 5-LOX expression, and increased inflammation in the corpus callosum. Here, we see altered blood vessel structure in the treatment groups (cholesterol: B, F, J; hydrogenated soybean oil: C, G, K; and saturated fat: D, H, L) compared to control (soybean oil: A, E, I). Magnification = 10 × , scale bar = 50 μm (E–H). Magnification = 40 × , scale bar = 200 μm (I–L).

