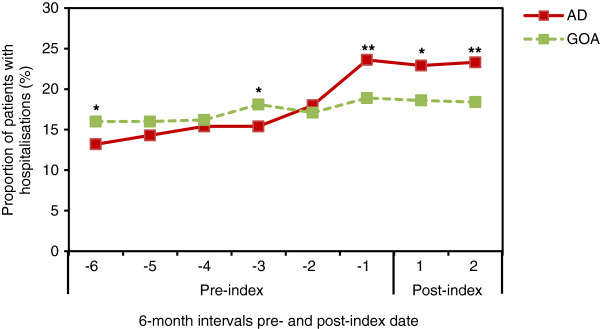
Figure 5.

Proportion of patients with at least one hospital admission. HES-eligible patients included n = 1,785 for the AD cohort and n = 3,407 for the GOA cohort. For AD vs. GOA comparisons, *p ≤ .01 and **p < .0001. The x-axis values represent 6-month intervals pre- and post-index (AD diagnosis) date. AD = Alzheimer’s disease; GOA = general older adult; HES = Hospital Episode Statistics.
