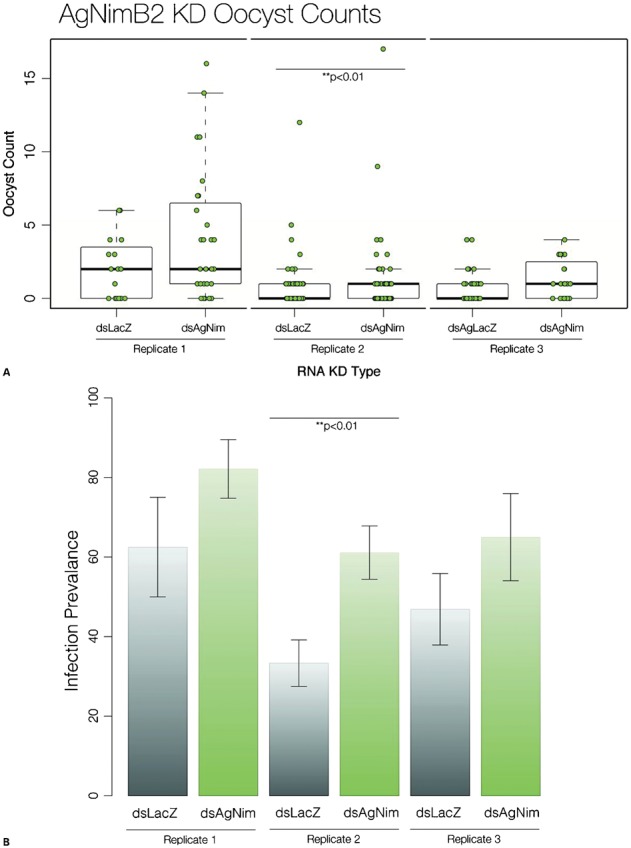
Figure 3.

AgNimB2 and AgEaters effect on Plasmodium berghei infection. (A) P. berghei oocyst counts in AgNimB2 knockdown (KD) and LacZ controls. Each dot represents one mosquito, with three replicates shown for each gene KD. Bar plot indicates median (bold line), inter quartile range (IQR), and 1.5×IQR (dotted line). Medians were compared using a Wilcoxon rank sum test with continuity correction. (B) Mean Anopheles gambiae infection prevalence of infected mosquitoes (shown as percentage) for AgNimB2 KD. Means were compared using two sample t-test. Errors bars show the standard error of the mean.
