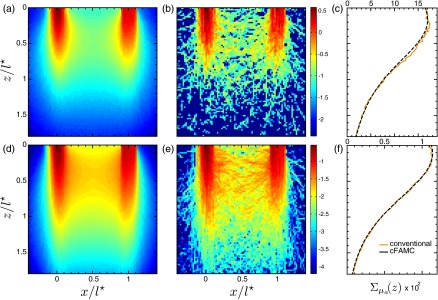
Fig. 4.

Spatially resolved absorption sensitivity distributions are displayed on a scale for and for highly scattering media (a–c) and moderately scattering media (d–f). Distributions are displayed for the plane at (a, b, d, and e) for cFAMC (a, d) and the conventional approach (b, e). The corresponding depth-dependent cumulative absorption sensitivity is plotted for both approaches (c, f).
