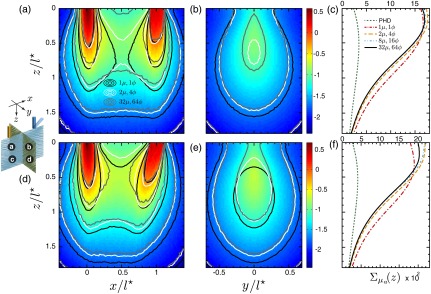
Fig. 6.

Spatially resolved absorption sensitivity distributions are displayed on a scale for highly scattering media with for (a–c) and (d–f). Distributions are displayed for the plane at (a, d) and the plane at (b, e), where the colormap provides the results obtained using fine angular discretization. The corresponding depth-dependent cumulative absorption sensitivity is plotted for the four angular discretization cases and the PHD (c, f).
