
Fig. 4. Dose-dependent effect of H2O2 on NO generation rate from nNOS.
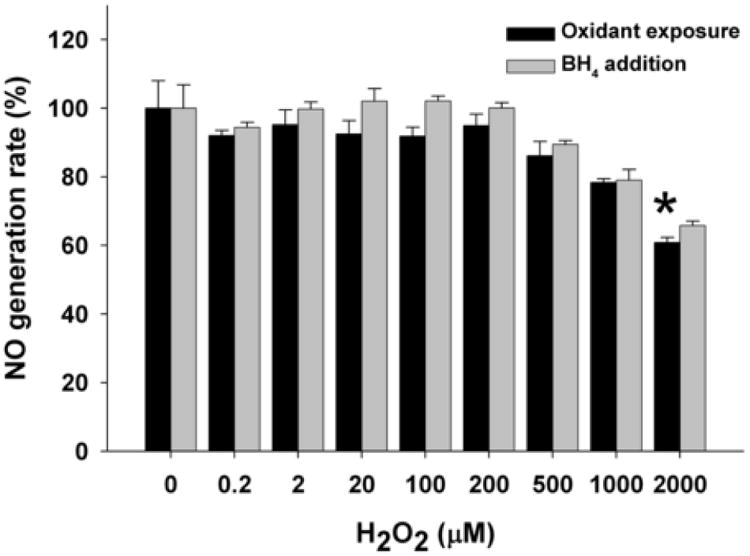
BH4 and NADPH saturated nNOS was incubated with 400 μM DTPA and increasing concentrations of H2O2 (0-2000 μM) for 20 min on ice and 400 unit/ml catalase was added to remove the residual H2O2 before the assay. NO generation rate was measured using oxyhemoglobin assay containing 200 μM NADPH, 200 μM CaCl2, 150 μM DTT, 10 μg/ml CaM, 10 μM oxyhemoglobin, 100 μM L-Arginine, with or without subsequent addition of 100 μM BH4. The NO generation rates were calculated from the initial rates and are given as percentage of the activity of the 0 μM H2O2-treated nNOS. Data are presented as mean ± S.E. of triplicate experiments. Data are presented as mean ± S.E. of triplicate experiments. * Indicates a significant (P < 0.05) difference from the corresponding untreated control.