
Fig. 7. Peak integration results of gel filtration chromatography.
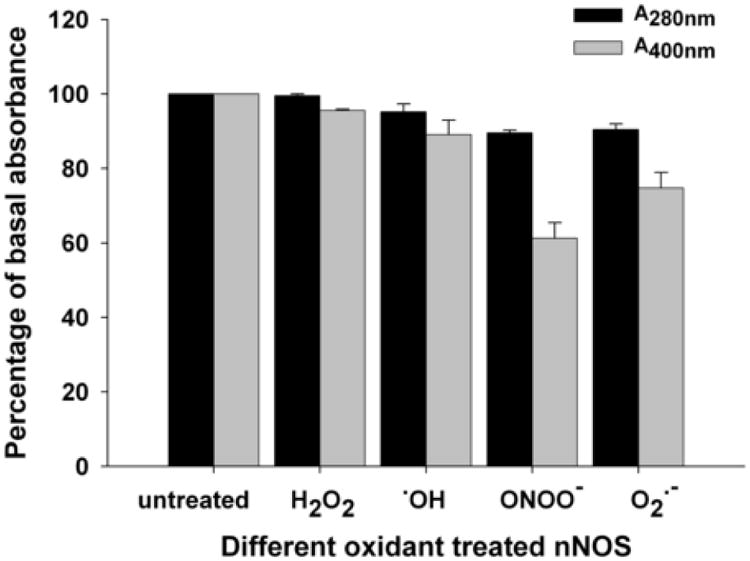
The absorbance of untreated nNOS at 280nm (black bar) and 400nm (gray bar) are used as basal control. The total absorbance of dimer and monomer peaks of oxidant treated nNOS is shown as percentage of the basal control. Data are presented as mean ± S.E. of triplicate experiments.