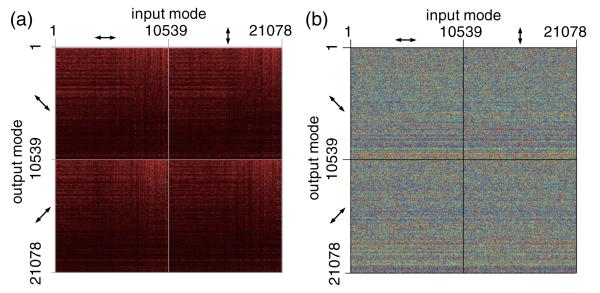
FIG. 2.
(color online) (a) Amplitude and (b) phase of the reconstructed TM (a sampled representation of the rows and columns is shown). Row and column numbers indicate the spatial frequency mode indices of the outgoing and incoming complex wave fields, respectively. Arrows represent polarization direction.

