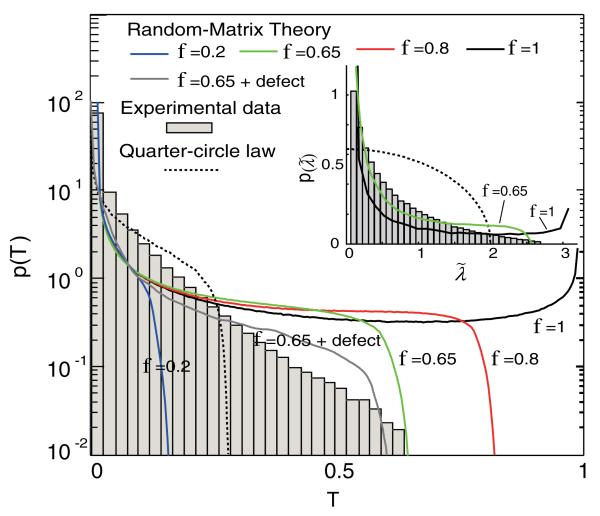
FIG. 3.
(color online) Transmission eigenvalue distribution of the measured TM. The lines represent RMT simulations with full information (black line), information on only a fraction f 0.65 of the incident and transmitted modes (green line), and incorporation of an additional defect factor of 24% (gray line). Dashed line represents distribution from the quarter-circle law. (Inset) Normalized singular values distribution of the measured TM.

