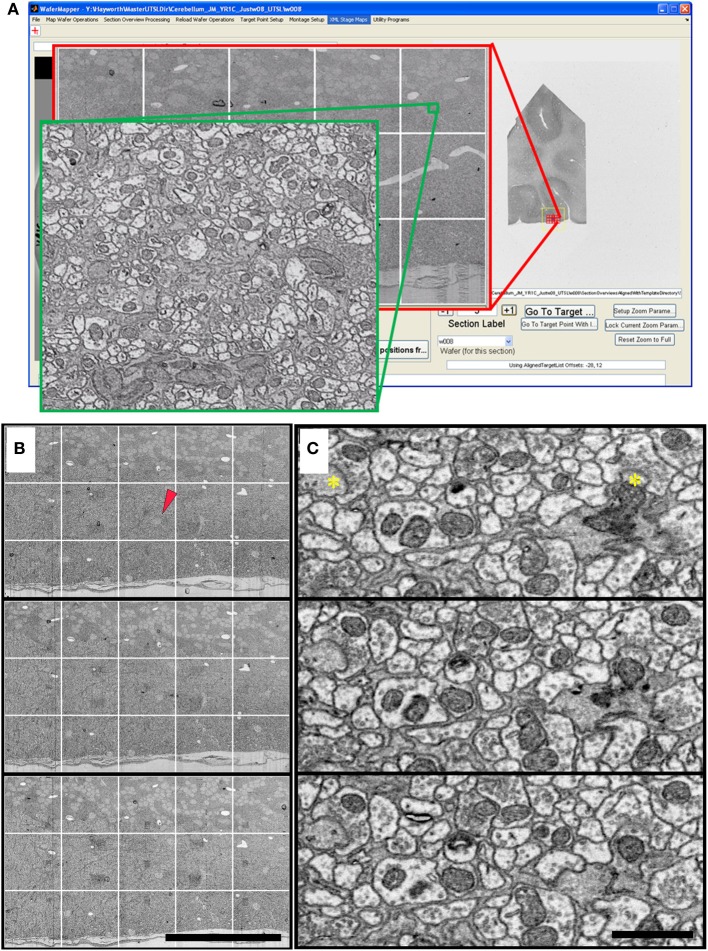
Figure 9.
Cerebellum UTSL example data. (A) Image of WaferMapper GUI showing a graphically-defined 3 × 5-tile montage targeted near the surface of a cerebellar folium. Zoom overlays show high resolution images of that region. (B) Montage images of three successive ultrathin sections in this cerebellum UTSL acquired automatically by WaferMapper (scale bar = 100 μm). Red arrow shows location of corresponding high resolution images shown in (C). (C) Cut outs of high resolution data imaged at 10 MPS and aligned in FIJI (scale bar = 1 μm). Asterisks mark position of two synapses.

