Fig. 2.
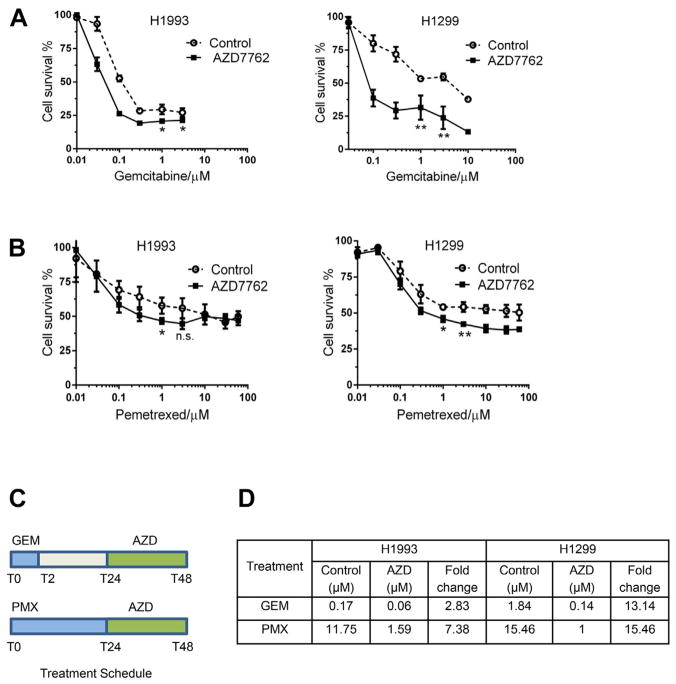
Chemosensitization to gemcitabine and pemetrexed in H1299 and H1993 cells as measured by the WST-1 assay. Cells were treated with graded concentrations of gemcitabine (T0–T2 h) or pemetrexed (T0–T24 h) followed by 24 h treatment with AZD7762 at 100 nM (T24–T48 h). H1299, high CHK1 expressing cell line was sensitized to gemcitabine (A) or pemetrexed (B) treatment to a greater extent as compared with H1993, low CHK1 expressing cell line. At 3 μM treatment there was statistically significant reduction in proliferation in H1299 (P = 0.0036 with gemcitabine and P = 0.0042 with pemetrexed treatment) as compared with H1993 (P = 0.0393 with gemcitabine and P = 0.0774 with pemetrexed treatment). (C) The in vitro treatment schedule with gemcitabine, pemetrexed, and AZD7762. (D) Differences in IC50 of gemcitabine and pemetrexed with and without AZD7762 treatment. There is a greater reduction in IC50 in H1299 cell lines with both treatments. (Color version of figure is available online.)

