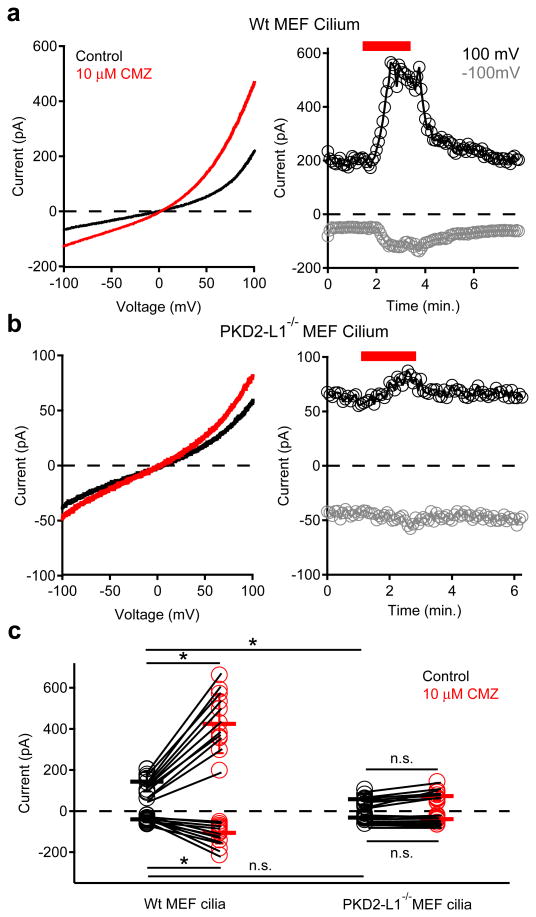
Figure 3. MEF primary cilium currents compared from wt and PKD2-L1 null animals.
Left; Cilium currents recorded from MEFs isolated from (a) wt and (b) PKD2-L1-/- animals. Currents were elicited by a series of ramps from -100 to +100 mV in control conditions (black traces) or in the presence of 10 μM calmidazolium (CMZ, red trace). Right; Resulting current amplitudes (-100 mV, grey circles; +100 mV, black circles) plotted as a function of time. Red bar indicates application of extracellular 10 μM CMZ. (c) Scatter and whisker (± SD) plots of current magnitudes at +100 mV and -100 mV from MEF cilia. Individual cilia are represented as connected circles in control (black) and after calmidazolium (red). Averages are indicated by the dark horizontal lines. Student's t-test results: * denotes P-value < 0.05; n.s. denotes P-value > 0.05; n = 9-11 cilia.

