
Fig. 1.
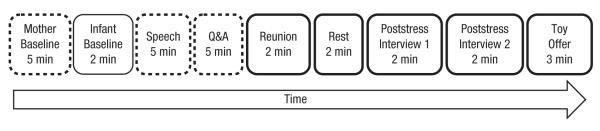
Overview of the procedure. Dashed outlines indicate that the mother was alone; for all other periods, the mother and infant were together. Bold outlines indicate the periods from which the mother’s and infant’s physiological data were taken for covariation analyses. Q&A = question-and-answer session.