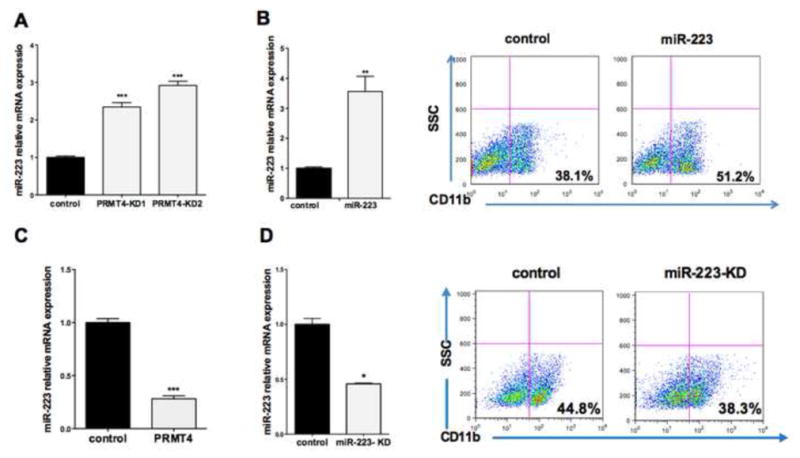
Figure 3. PRMT4 regulates miR-223 expression.

(A). PRMT4 downregulation leads to upregulation of miR-223 expression. qRT-PCR data represents the mean ± SD of three independent experiments. *** p < 0.001 by Student's t test.
(B). Overexpression of miR-223 in HSPCs enhances myeloid differentiation. (Left) qRT-PCR data represents the mean ± SD of three independent experiments. ** p < 0.01 by Student's t test. (Right) Cells were plated in myeloid differentiation promoting culture and assayed for CD11b expression after 7 days.
(C). Overexpression of PRMT4 diminishes miR-223 expression. qRT-PCR data represents the mean ± SD of three independent experiments. *** p < 0.001 by Student's t test.
(D). Knock down of miR-223 in HSPCS slightly impairs myeloid differentiation. (Left) qRT-PCR data represents the mean ± SD of three independent experiments. * p < 0.05 by Student's t test. (Right) Cells were plated in myeloid differentiation promoting culture and assayed for CD11b expression after 7 days.
See also Figure S3.
