
Figure 1.
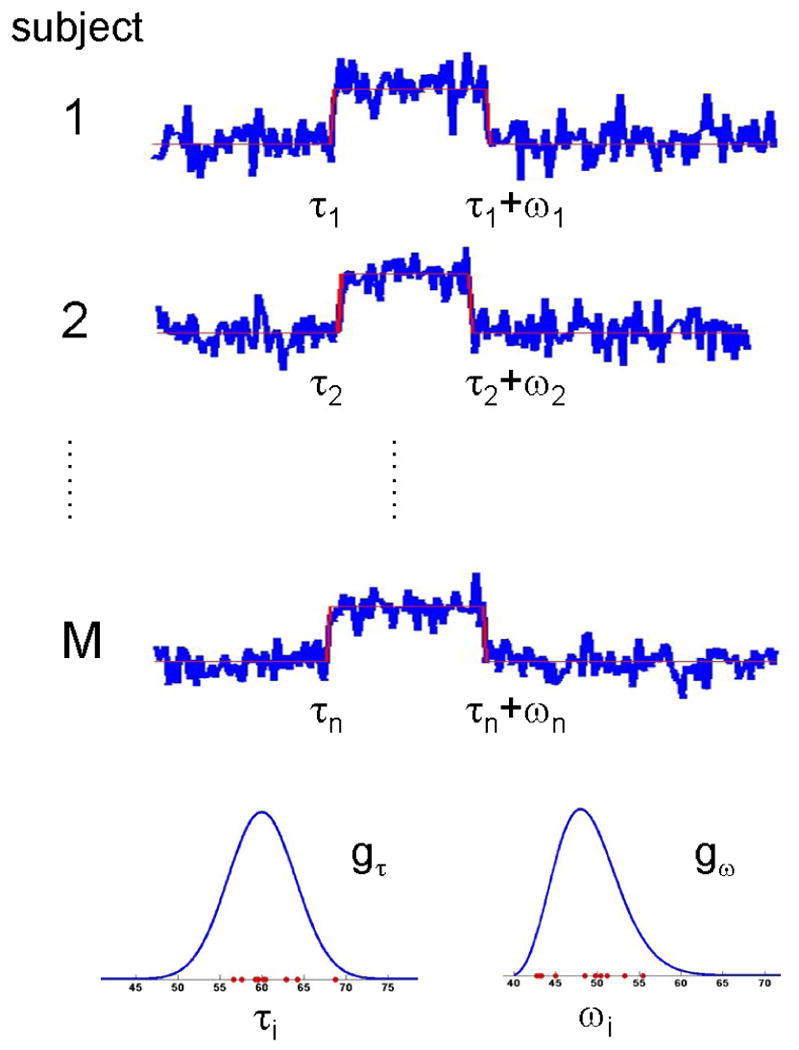
In our model formulation each subject is allowed to switch states up to two times. The timing of these state-changes are determined by change points τi and ωi, chosen at random from the population distributions gτ and gω, respectively. In this formulation, gτ represents the population distribution of the onset of activation, while gω represents the population distribution of the duration.