
Figure 8.
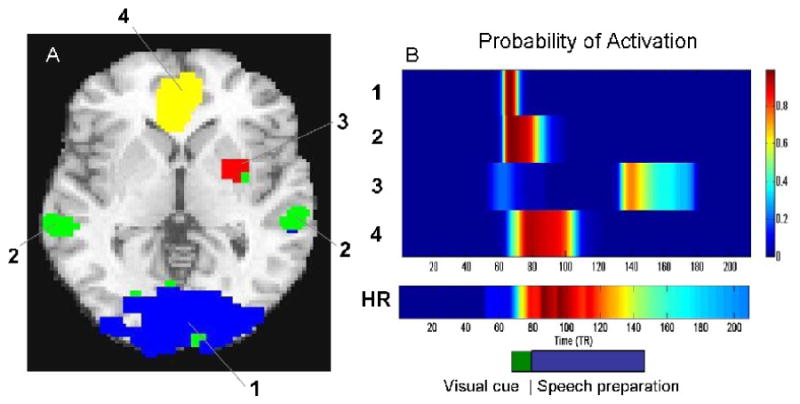
(A) The brain is split into 4 clusters of spatially coherent activation. (B) The estimated probability of activation is shown in a heat map for each of the four clusters. In addition the probability of elevated heart rate (HR) is shown. The timing of the original visual cue and the speech preparation is shown in block format on the bottom right hand side for comparison purposes. Activation in the ventromedial prefrontal cortex (Cluster 4) correlates highly with heart-rate increases in the task.