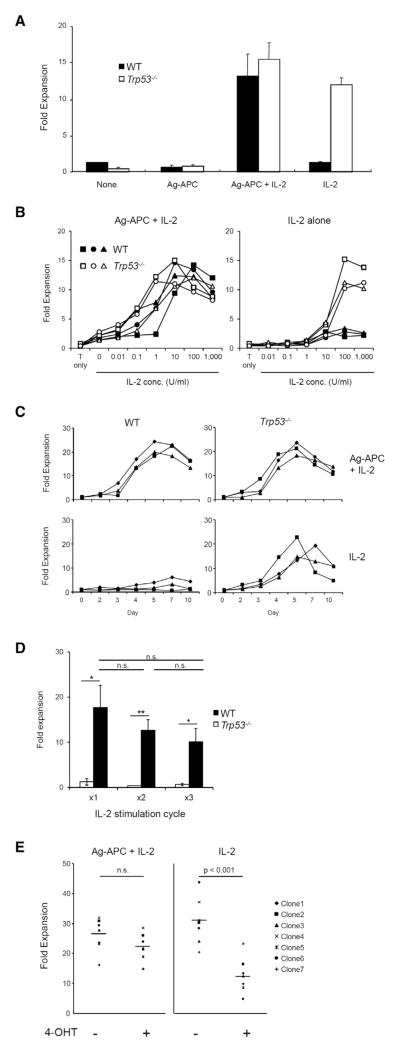
Figure 1. Antigen-Specific Trp53−/−, but Not WT, CD4+ T Cell Clones Proliferate in Response to IL-2 in the Absence of Antigenic Stimulation.
(A) WT and Trp53−/− KLH-specific CD4+ T cell clones were cultured for 10 days under indicated conditions. Fold expansion was calculated as (recovered cell number/initial cell number). Mean ± SEM is shown (three clones per genotype). The data are representative of at least three independent experiments.
(B) IL-2 dose response for cell expansion of WT and Trp53−/− CD4+ T clones. Three clones each of WT and Trp53−/− were stimulated under indicated conditions for 10 days and fold expansion was calculated. The graph is representative of two independent experiments.
(C) Kinetic analysis of fold expansion of CD4+ T clones. Three clones each of WT and Trp53−/− were stimulated with Ag-APC + IL-2 or IL-2 alone, and fold expansion at indicated time points was calculated. The graph is representative of three independent experiments.
(D) Three clones each of WT and Trp53−/− were stimulated with IL-2 alone for 10 days in 3 consecutive cycles without Ag-APC stimulation. Fold expansion was calculated at the end of each cycle. The graph is mean ± SEM and representative of at least three independent experiments.
(E) KLH-specific CD4+ T cell clones established from p53ER-TAM mice were stimulated with Ag-APC + IL-2 or IL-2 alone in the presence or absence of 4-hydoroxy-tamoxifen (4-OHT) for 10 days and fold expansion was calculated. The data are representative of three independent experiments.
*p < 0.05; **p < 0.01. See also Figure S1.

