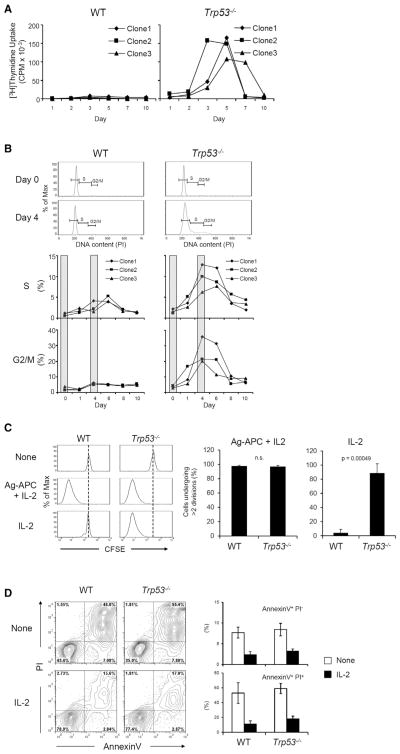
Figure 3. p53 Suppresses Cell Cycle Progression in Response to Stimulation with IL-2 Alone.
(A) DNA synthesis of CD4+ clones upon IL-2 stimulation. WT and Trp53−/− clones were stimulated with IL-2 (100 U/ml), and DNA synthesis at indicated time points was analyzed by measuring [3H]thymi-dine incorporation. The result is representative of three independent experiments.
(B) Cell cycle progression of CD4+ clones upon IL-2 stimulation. WT and Trp53−/− clones were stimulated with IL-2, and DNA content at indicated time points was analyzed by propidium iodide (PI) staining. The result is representative of two independent experiments.
(C) Cell division of CD4+ clones upon IL-2 stimulation. WT and Trp53−/− clones were stained with CFSE and cultured under indicated conditions for 10 days. CFSE dilution was analyzed to evaluate cell division by flow cytometry. The graph indicates percent of cells dividing more than two times as mean ± SEM of three clones each of WT and Trp53−/−. The result is representative of three independent experiments.
(D) Cell death of CD4+ clones upon IL-2 stimulation. WT and Trp53−/− clones were stimulated with IL-2 for 48 hr. Percent dead cells were evaluated with AnnexinV and PI staining by flow cytometry. The graphs shown are mean ± SEM of three clones each of WT and Trp53−/− and representative of two independent experiments.

