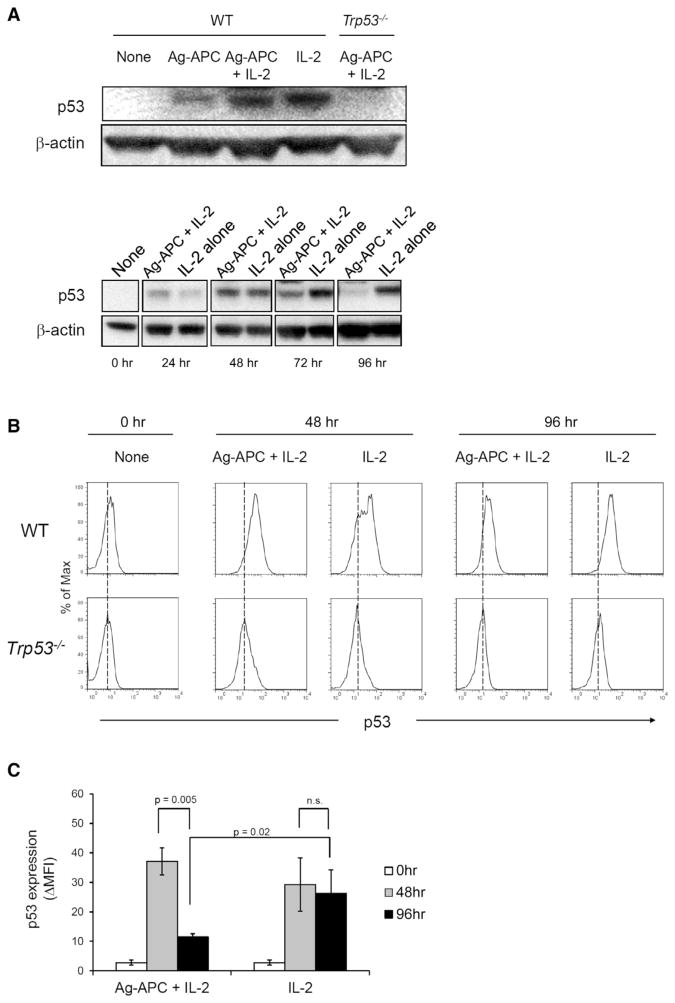
Figure 4. Antigen Stimulation Downmodulates p53 Expression Induced by IL-2.
(A) WT clones were stimulated for 48 hr (top) and for the indicated times up to 96 hr (bottom), and p53 protein was analyzed by immunoblotting. β-actin was used as internal control. The data are representative of three independent experiments.
(B) WT and Trp53−/− clones were stimulated as indicated for 96 hr and p53 protein expression was analyzed by flow cytometry. Trp53−/− clones were used as a negative control for p53 staining. Results are representative of three independent experiments.
(C) Statistical analysis of the results shown in (B). The graph presents means ± SEM of three clones each of WT and Trp53−/− and representative of three independent experiments.

