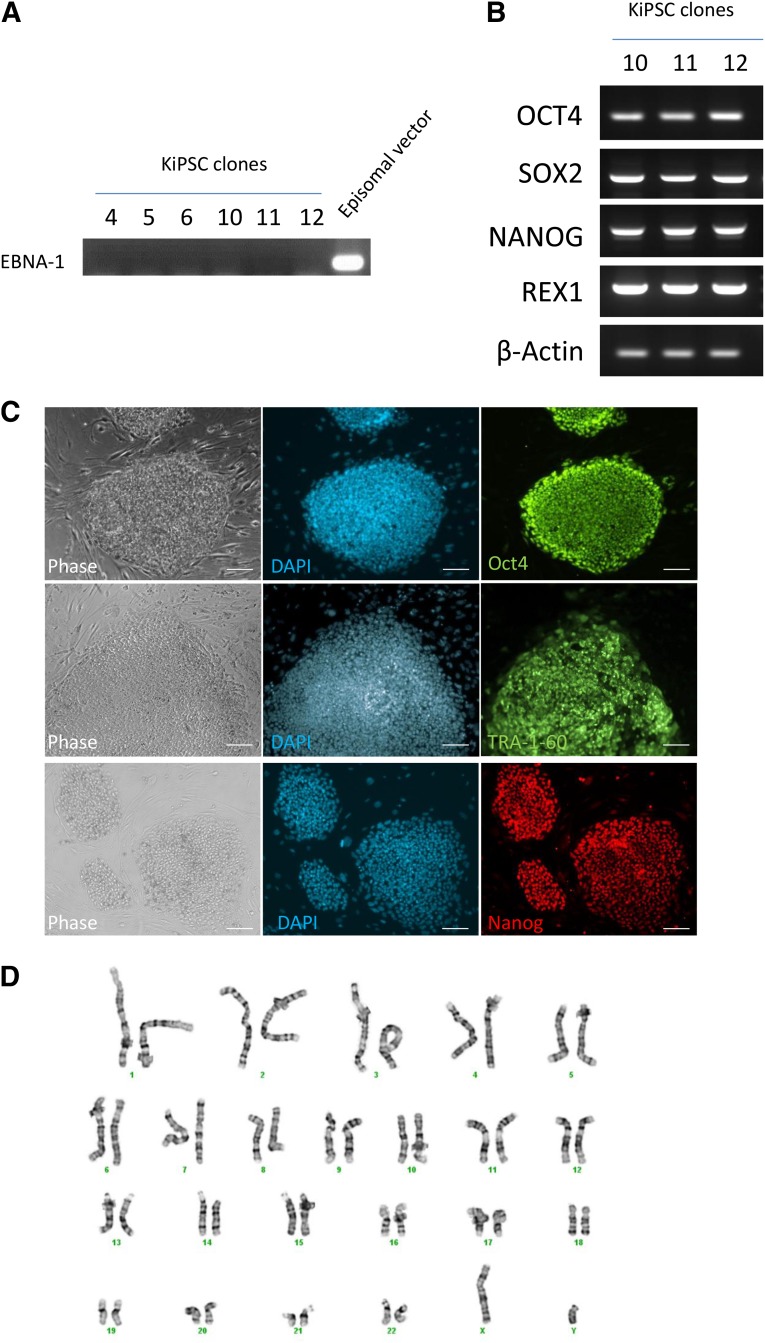
Figure 2.
Characterization of KiPSC clones. (A): Reverse transcription polymerase chain reaction (RT-PCR) analysis of EBNA-1 integration in isolated keratinocyte-derived hiPSC clones. The episomal vector was used as a positive control. (B): RT-PCR analysis of pluripotent gene expression OCT4, SOX2, NANOG, and REX1 in KiPSC clone 10-12. β-actin was used as loading control. (C): Immunocytochemistry analysis of pluripotent markers OCT4 (green), TRA-1-60 (green), NANOG (red), and DAPI counterstain (blue) in established KiPSCs. Scale bar = 100 μm. (D): G-band karyotyping of KiPSCs (passage 6). Abbreviations: DAPI, 4′,6-diamidino-2-phenylindole; KiPSC, hiPSC colonies generated from keratinocytes.

