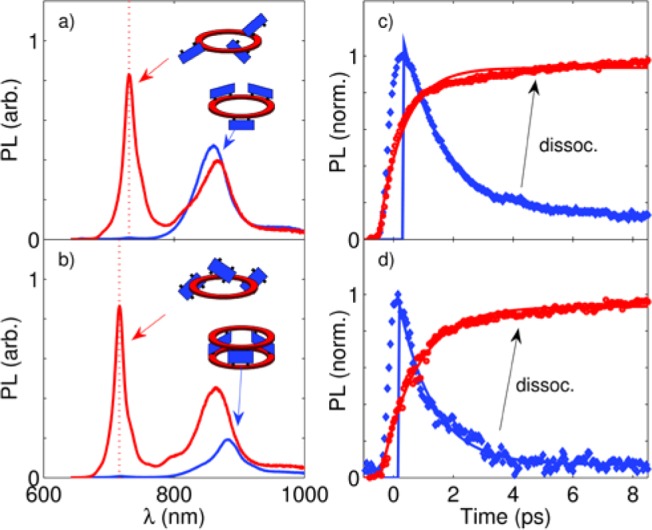
Figure 3.

(a, b) Steady-state PL spectra for the (a) ring–dimer and (b) ring–dimer–ring complexes in the associated (blue line) and dissociated (red line) states. The dimer emission wavelength is indicated by the vertical dashed red lines. (c, d) Time-resolved PL dynamics for dimer emission for the (c) ring–dimer and (d) ring–dimer–ring structures for each association state.
