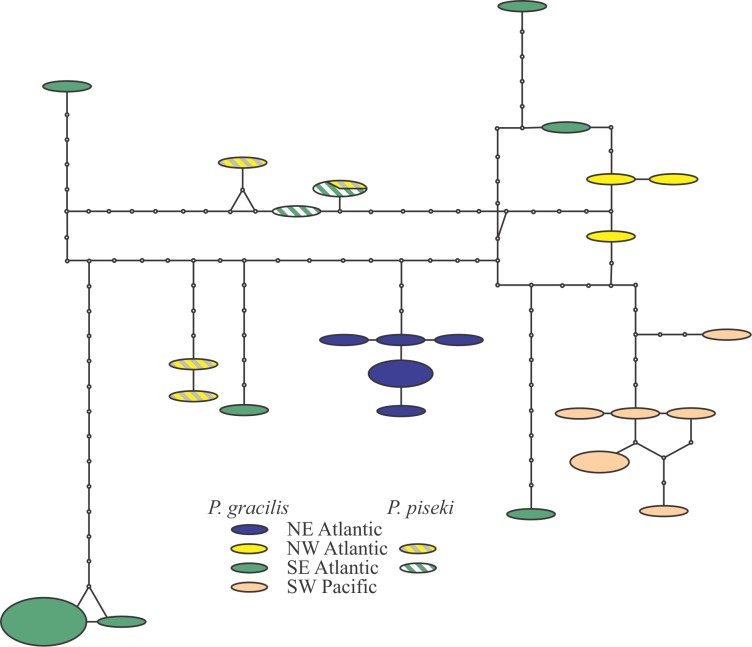
TCS analysis on the Pleuromamma piseki and Pleuromamma gracilis sequences.
Each segment represents a mutational step, and small black circles are missing haplotypes needed to connect observed haplotypes. The size of the ovals is proportional to the number of sampled individuals with that haplotype. All sites containing ambiguous or missing data were excluded from the analysis (complete deletion; final length 502 bp). The resulting diagram reflects a strong regional pattern, with relative isolation between the different ocean basins especially in the North-South axis. The Antarctic region shows a strong isolation even from the close individuals from the Southern Hemisphere.

