
Fig. 12.
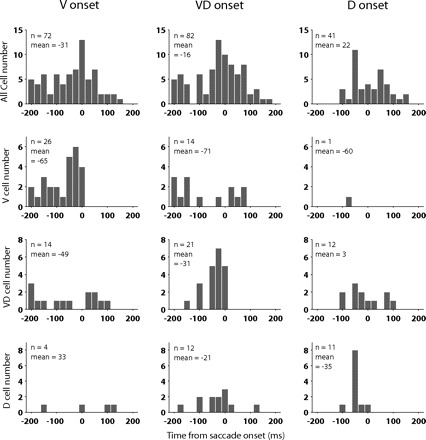
Distribution of onset of significant selectivity for value, direction, and their interaction. For each individual SEF neurons, the time bin relative to saccade onset was plotted, at which the regression function was 1st significantly influenced by value (left), value-direction interaction (middle), and direction (right). In the top row, we plotted the onset times of the 3 terms for all task-related neurons. In the next 3 columns, we plotted the onset times for the 27 V-neurons (top middle row), 22 VD-neurons (bottom middle row), and 13 D-neurons (bottom row) as classified by the regression method. For each neuronal population and regression term, we indicate the number of neurons, for which we could determine an onset time and the mean of the onset distribution.