
Fig. 3.
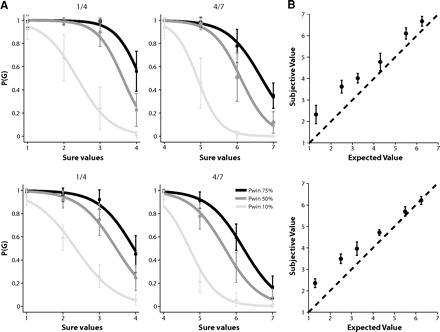
A: choice functions of monkeys A (top) and B (bottom). The probability that the monkey chooses a particular gamble option is plotted as a function of the value of the alternative sure option. The reward size is indicated as multiples of a minimal reward amount (30 μl). Left: gamble options that yield either 30 μl (1 unit) or 160 μl (4 units) with a 10% (light gray line), 50% (dark gray line), and 75% (black line) chance of receiving the larger outcome. Right: gamble options that yield either 160 μl (4 units) or 160 μl (7 units) with a 10% (light gray line), 50% (dark gray line), and 75% (black line) chance of receiving the larger outcome. B: comparison of subjective value (utility) and expected value of a gamble option. The subjective value of a gamble option was estimated from behavior and plotted against its expected value (the average amount of the 2 possible outcomes weighted by their probability). The reward size is indicated as multiples of a minimal reward amount (30 μl). The subjective value is consistently larger than the expected value, indicating that the monkey overvalued the gamble options and behaved in a risk-seeking fashion. The figure represents the grand average over all choice trials recorded from monkeys A (top) and B (bottom).