
Fig. 8.
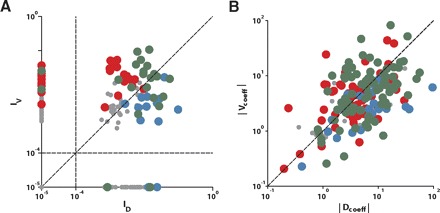
Comparison of the degree to which a neuron reflects saccade value or direction. Red, green, and blue dots: V-neurons, VD-neurons, and D-neurons, respectively. Remaining task-related cells that do not belong to any of those 3 functional groups are shown in gray dots. The classification of the neurons into the 3 functional groups, indicated by the color of the dots, was based on the regression analysis (A) and the information analysis (B). A: comparison of the mean information about saccade direction (ID) and value (IV) in the 100 ms before saccade onset. B: comparison of the coefficient strength of value (Vcoeff) and direction (Dcoeff) term in regression model in which those 2 terms are linearly connected. Absolute value of the coefficient was used to evaluate the degree of influence of each term.