
Fig. 2.
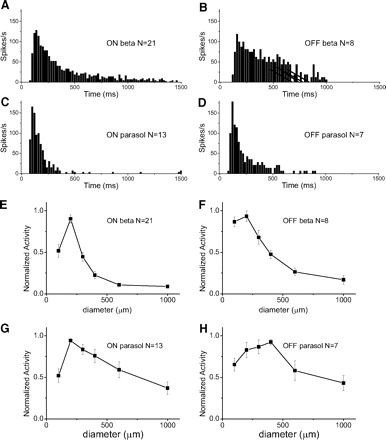
Properties of evoked spikes of 4 types of GCs. A–D: average peristimulus time histogram (PSTH) maps when white spot is on in on beta and on parasol cells, and when white spot is off in off beta and off parasol cells. Zero millisecond indicates the initiation of stimuli. Spot size, 200 μm; Bin size, 10 ms. E–H: spot size vs. normalized activity. Error bar, SE. All cell types show suppression of activity with large spots suggesting surround inhibition.