
Fig. 5.
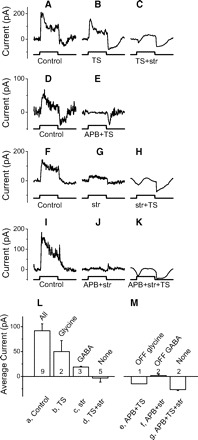
Off beta cells receive on glycinergic and very weak GABAergic feedforward inhibition. A–K: inhibitory currents with different combinations of drugs in 4 off beta cells. Each row represents recordings from 1 cell. Top 2 rows: isolating the glycinergic currents. Bottom 2 rows: isolating the GABAergic currents. Spots are 400 μm. L: average on currents; M: average off currents for each transmitter. The average results are only from the stimuli with 400 μm spots.