
Fig. 1.
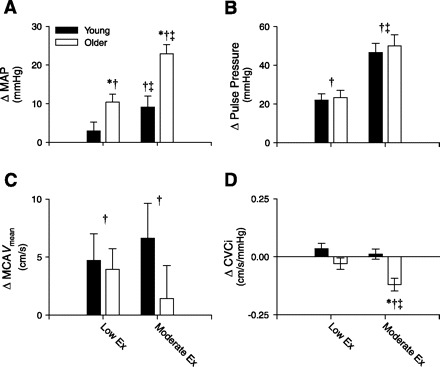
Summary data showing the changes (Δ) from rest in mean arterial pressure (MAP; A), pulse pressure (B), middle cerebral artery mean blood velocity (MCAVmean; C), and the cerebral vascular conductance index (CVCi; D) during low-intensity (Low Ex) and moderate-intensity (Moderate Ex) leg cycling in young and older subjects. *Significantly different from young (P < 0.05). †Significantly different from rest (P < 0.05). ‡Significantly different from Low Ex (P < 0.05). Values are means ± SE.