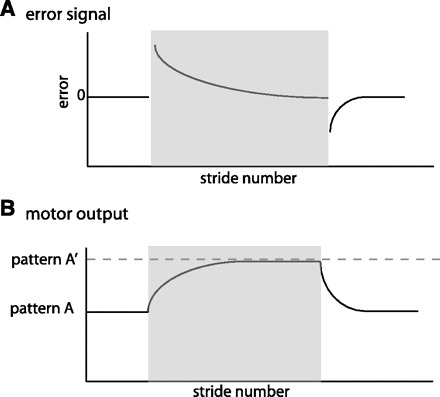
Fig. 1.

Schematic of error signal and motor output. Shaded region represents the adaptation period. A: parameters quantifying error are perturbed early in adaptation and decrease throughout adaptation. They also show the opposite perturbation in deadaptation. B: motor outputs exhibit a smooth change from a set pattern A to a new value during adaptation (pattern A′), set by the environmental conditions. They also must be actively deadapted with a smooth transient from pattern A′ to pattern A when environmental conditions change back to the original state.
