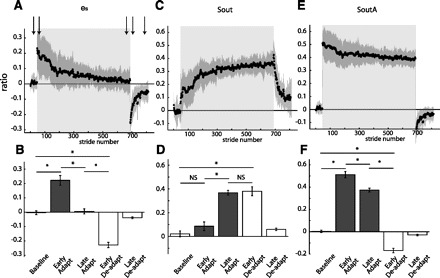
Fig. 6.

Group averages of spatial parameters throughout experiment 1 are shown similarly to the temporal parameters in Fig. 4. Adaptation period is represented by shaded area. Arrows represent time correspondence between bar graphs and group average curves; the first arrow corresponds to the first epoch (baseline), and so forth. A: stride-by-stride time course of the spatial error (es) characterized by the difference in angular ratios. B: key epochs are shown for the es. C: stride-by-stride time course of the spatial motor output (Sout) characterized by a normalized difference in limb angles at heel-strike. D: key epochs are shown for the Sout. E: stride-by-stride time course of the spatial motor output (SoutA) characterized by the normalized difference of limb angles at toe-off. F: key epochs are shown for the SoutA. Like their temporal counterparts, es follows the characteristic time course of a motor error and Sout of a motor output. On the other hand, the alternative motor output parameter based on toe-off timings (SoutA) does not exhibit the characteristics of motor outputs: smooth transitions when environmental conditions change and rise from one steady state to another during adaptation.
