
Fig. 4.
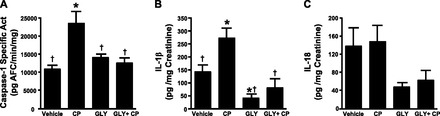
Effects of Gly on inflammasome activation in urothelia and urinary cytokine levels. Rats were subjected to the treatment regimen shown in Fig. 3. At the end of treatment, urine was collected, and urothelia were isolated and assayed as described in materials and methods. A: caspase-1 activity in urothelia after the indicated treatments. Bars are means ± SE; n = 5 for each group. *Significant (P < 0.001) difference from control as assessed by ANOVA modeling and Fisher's least-significant-difference (LSD) test; †significant (P < 0.002) difference from vehicle + CP treatment. B: IL-1β levels in urine after the indicated treatments normalized to creatinine. Bars are means ± SE; n = 3 for vehicle, 5 for CP, 3 for Gly, and 3 for Gly + CP treatment. *Significant (P < 0.02) difference from control as assessed by ANOVA modeling and Fisher's LSD test; †significant (P < 0.02) difference from vehicle + CP treatment. C: IL-18 levels in urine after the indicated treatments normalized to creatinine. Bars are means ± SE. No significant differences were detected.