
Fig. 5.
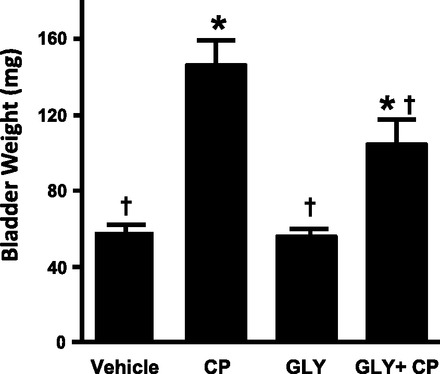
Effect of Gly on CP-induced bladder weight changes. Rats were subjected to the treatment regimen shown in Fig. 3. At the end of treatment, bladders were harvested, cleaned of all fat, and weighed. Bars are means ± SE; n = 4 for vehicle, 8 for CP, 4 for Gly, and 7 for Gly + CP treatment. *Significant (P < 0.05) differences from control as assessed by ANOVA modeling; †significant difference from vehicle + CP treatment.