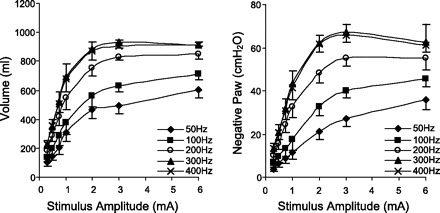
Fig. 2.

Relationships between stimulus amplitude and inspired volume (left) and negative Paw generation (right) at different stimulus frequencies. With increasing stimulus frequencies between 50 and 300 Hz, there were significant increases in the magnitude of these parameters. The 300- and 400-Hz curves, however, were not statistically different.
