
Fig. 5.
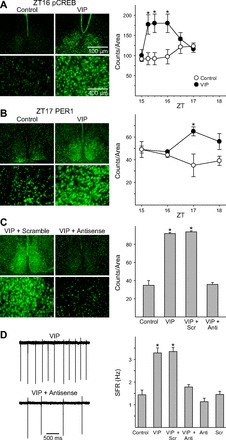
Persistent VIP-induced increases in electrical activity are dependent on PER1. A: photomicrographs illustrate that the application of VIP (1 μM) increases phospho-cAMP response element-binding protein (p-CREB) as measured by immunohistochemistry (IHC). Bar graphs show p-CREB-positive cell counts for control and VIP-treated groups (±SE). *Significant difference (P < 0.05) analyzed by 1-way ANOVA followed by Dunn's method for multiple comparisons (vs. control). ZT, zeitgeber time. B: photomicrographs illustrate that application of VIP (1 μM) increases PER1 protein as measured by IHC. Bar graphs show PER1-positive cell counts for control and VIP-treated groups (±SE). *Significant difference (P < 0.05) analyzed by 1-way ANOVA followed by Dunn's method for multiple comparisons (vs. control). C: photomicrographs illustrate that antisense against Per1 blocked the VIP induction of PER1. Bar graphs show PER1-positive cell counts for control and VIP-treated groups (+SE) exposed to antisense or scrambled message. Anti, group treated with antisense; Scr, group treated with scrambled message. D: representative examples showing that the application of VIP (1 μM) does not cause persistent increase in neural activity in the presence of antisense against Per1. Bar graphs show average firing rate for each group (+SE). *Significant difference (P < 0.05) analyzed by 1-way ANOVA followed by Dunn's method for multiple comparisons.