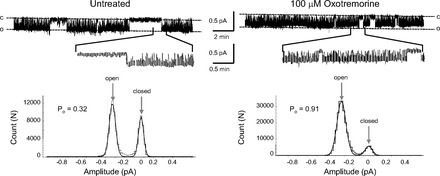
Fig. 2.

Representative recordings of cell-attached patches and amplitude histograms from AT2 cells before and after the muscarinic agonist, oxotremorine (100 μM). Downward deflections are inward current; “c” indicates the closed level; “o” indicates open events. Expanded segments of each trace are shown below the full-length record. Oxotremorine activated ENaC within 1 min. The amplitude histograms show that oxotremorine significantly increases the open probability of ENaC.
