
Figure 10.
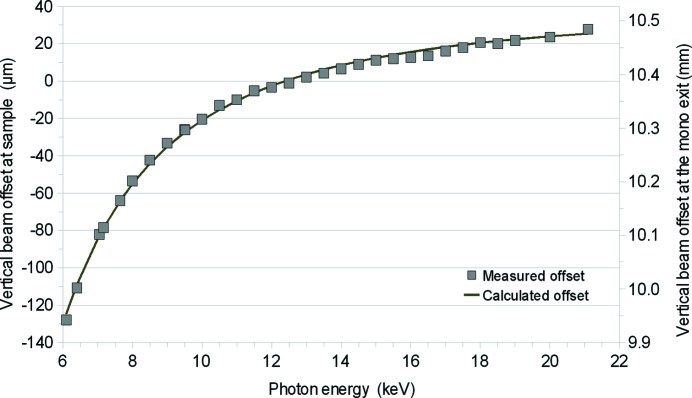
Vertical position of the beam depending on the photon energy at the sample position (left axis) and at the mono exit (right axis). The modelled curve with a gap between crystals of 5.253 mm (line) is in very good agreement with the measured position of the beam as measured with a fluorescing screen at the sample position (squares).