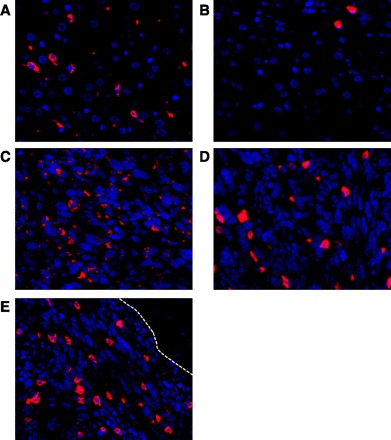
Fig. 2.

Immunofluorescence staining for macrophages and neutrophils in livers from mice with pancreatic adenocarcinoma. Blue signal in nuclear staining, images are ×40 amplification. A: low density of macrophages (red) is shown in the peritumor liver parenchyma. B: few neutrophils (red) are also present in the nontumor liver parenchyma. Macrophages (C) and neutrophils (D) are densely populated in the tumor microenvironment. E: neutrophil density is high at the leading edge of the tumor microenvironment (white broken line indicates tumor-liver interface).
