Fig. 5.

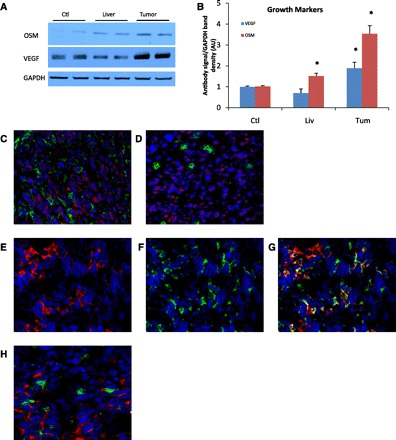
Tumor expression of oncostatin M (OSM) and VEGF. A: representative immunoblotting of OSM and VEGF from one experiment show increased expression of both in homogenates from the tumors. VEGF expression is nonsignificantly decreased in the liver parenchyma from malignant mice compared with control livers. GAPDH loading control (see Fig. 3), was reused as appropriate control for analytes. B: densitometry data normalized to control liver expression from seven experiments are represented. *P < 0.01 compared with control. Immunofluorescence of tumors is shown in C–F, images are ×40 amplification; blue signal denotes nuclear stain. C: increased signal of OSM (red) in the tumor colocalizes with macrophages (green). D: staining of OSM in the tumor does not colocalize well with neutrophils (green). E–G: staining for VEGF (red, E) signal in the tumor and macrophages (green, F) shows colocalization in the combined image (G). H: tumoral VEGF signal does not reveal colocalization with neutrophils (green).
